Why Look at One Sock Six Times? Loops and Colour in a Child’s Sock from Roman Egypt
Published · Updated
Research and writing: DDUJA KNIT
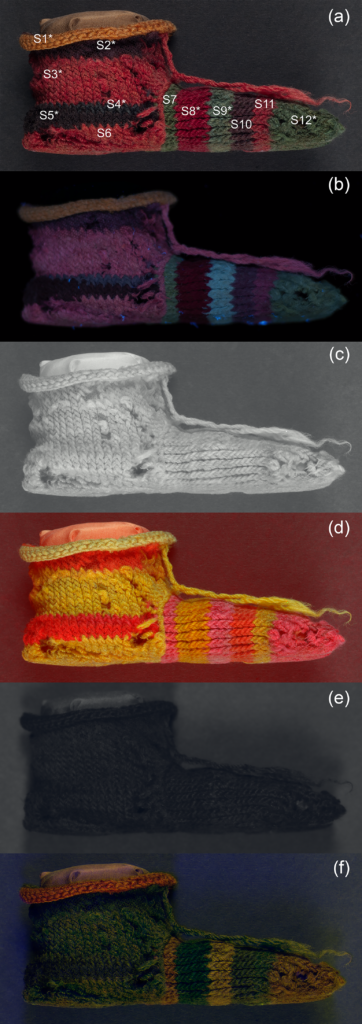
A 2018 research figure shows one small sock six times. The bands appear in visible light and respond differently to ultraviolet and infrared imaging. These are not six objects. They are six ways of looking at one. The images lead to two separate questions: what traces of colourants remain in the bands, and how were the loops around the divided toes made? Keeping those questions apart lets us read both the colour evidence and the object’s construction.
British Museum EA53913 is a wool sock for a child’s left foot, excavated at Antinoupolis in Egypt and radiocarbon dated to the third or fourth century CE.[1] The detailed collection record calls its construction single needle looping, sometimes called naalebinding. A 2018 study by Joanne Dyer, Diego Tamburini, Elisabeth R. O’Connell and Anna Harrison uses the same technical identification while examining the sock’s colours and fibres.[2] It is evidence for an ancient sock, but it should not be presented as an early surviving example of modern needle knitting.
Similar names do not turn separate museum objects into a pair. EA53912, also from Antinoupolis, is a right-foot sock of brown wool; its record likewise says single-needle looping.[3] The recorded length of EA53912 is 185 mm, compared with 125 mm for the child’s EA53913.[1][3] Their colour, size and recorded dating differ. Nothing in these records establishes that the two were originally worn together. Another split-toe sock, the red wool object 1901,0314.35, is described in its detailed record as needle netting and classified under looping.[4] Yet the museum’s 2024 Legion exhibition activity card calls the red sock knitted for a general audience.[5] A brief educational label and a technical catalogue entry answer different questions; keeping both wordings visible makes the limit of each clearer.
The researchers read EA53913 from the toes upwards. Dark green wool forms the big-toe section and the section for the other toes separately; the two sections are then joined before the bands continue.[2] The paper records ten rows of dark green at each toe, followed by bands including orange, purple, blue-green, dark red and green. The sole of the heel and the heel’s own coloured bands follow. A welt across the instep marks where loops were worked in the round. The upper edge is continuous and curls, while a loose red thread at the centre front may be part of a tie or tassel. These observations help us read an object’s construction. They do not turn a research description into a tested, workable modern pattern.
The twist of the yarn and the method used to build the textile answer different questions. The study and museum record describe wool yarn made from several S-spun strands plied in the Z direction.[1][2] That tells us about yarn preparation; it does not by itself identify two-needle knitting in the sock fabric. To examine construction, we have to follow the separately made toe sections and the collection record’s looping classification. Separating yarn structure from textile structure is useful whenever a museum description packs both into one short technical phrase.
Nor can the visible colour bands alone identify every dye. The team photographed the same sock under visible, ultraviolet and infrared conditions, then compared those images with reflectance measurements and analyses of selected tiny samples.[2] Figure 4 contains six views of one object, not six socks. Changing the illumination does not change the ancient yarn; it reveals different responses that can guide a more careful examination of its colourants.
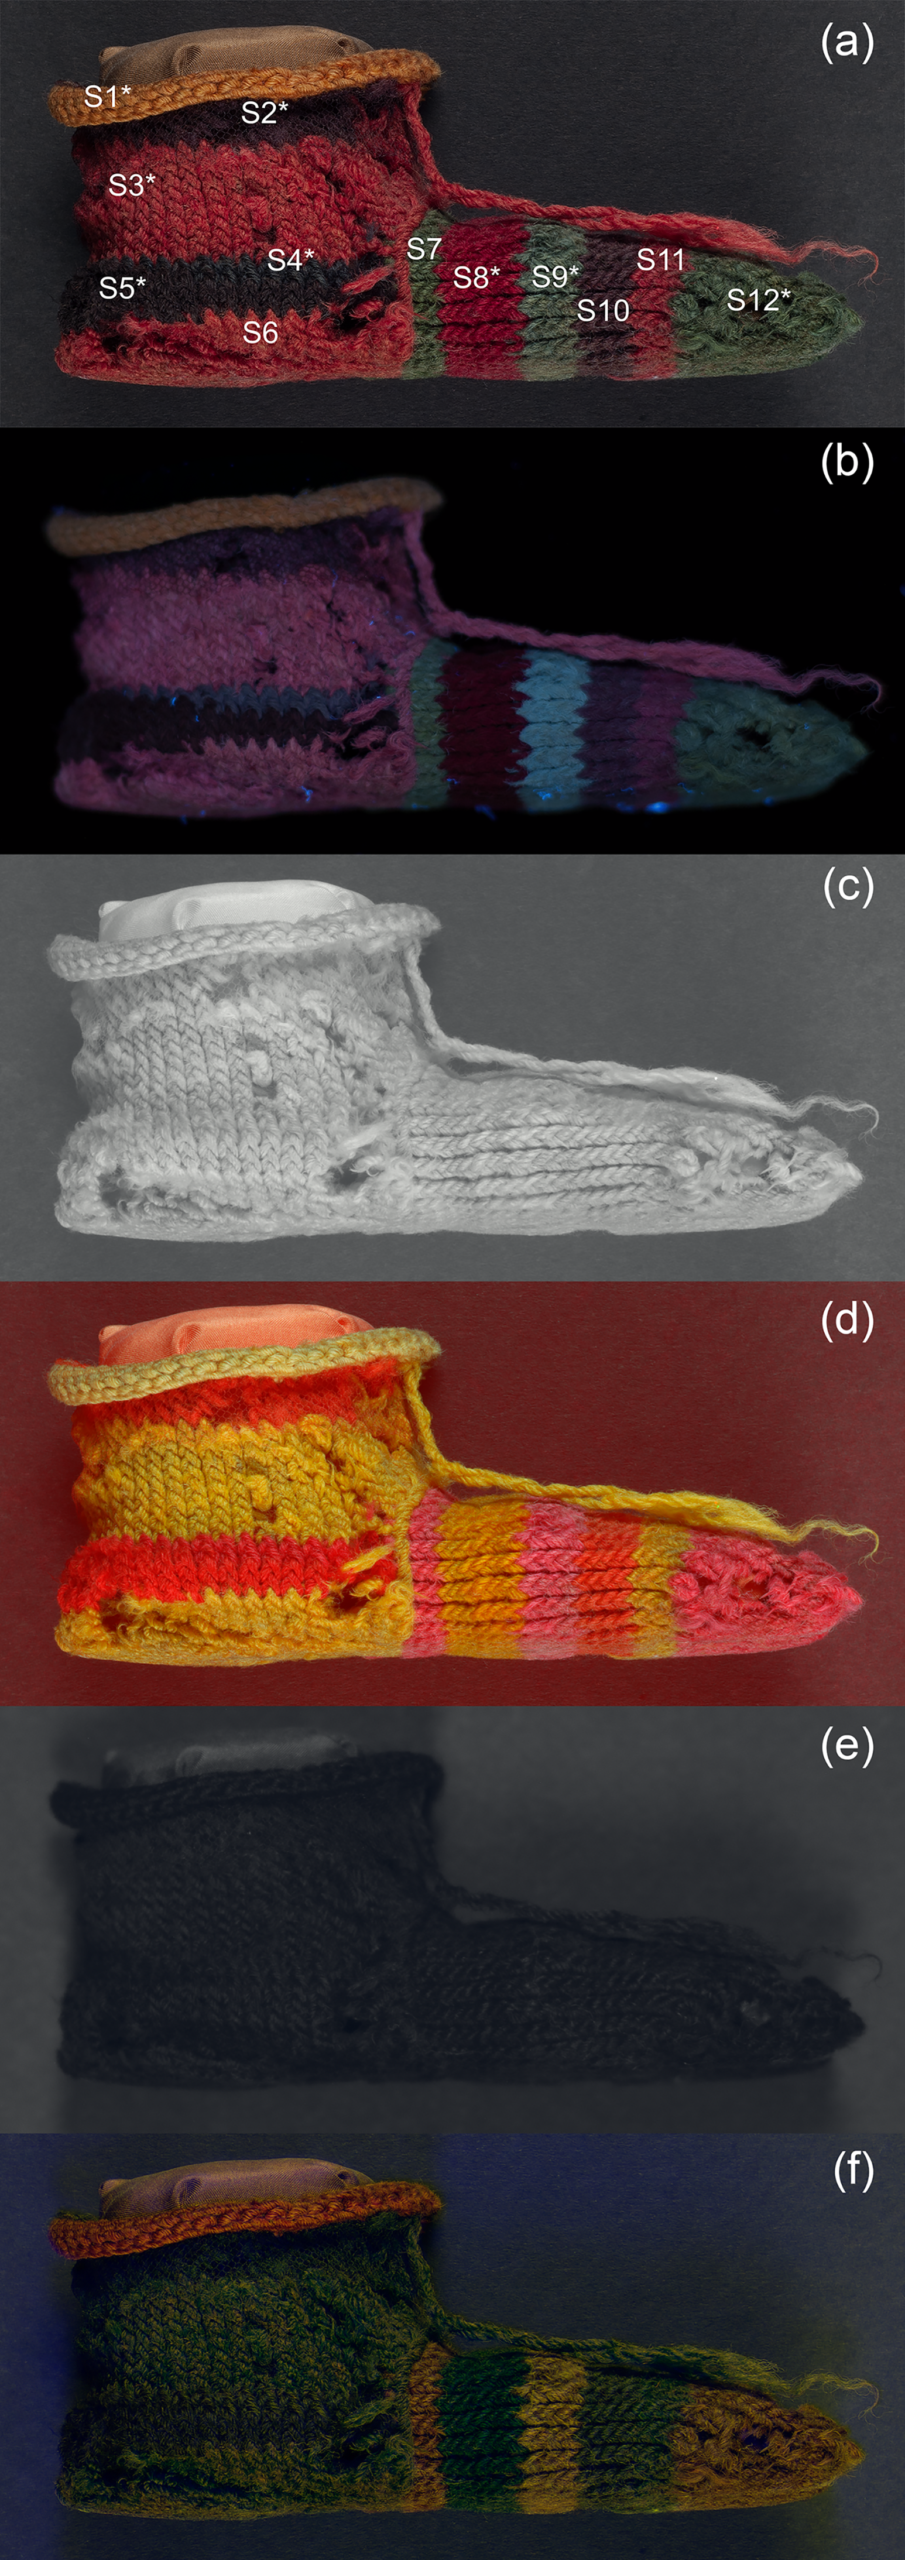
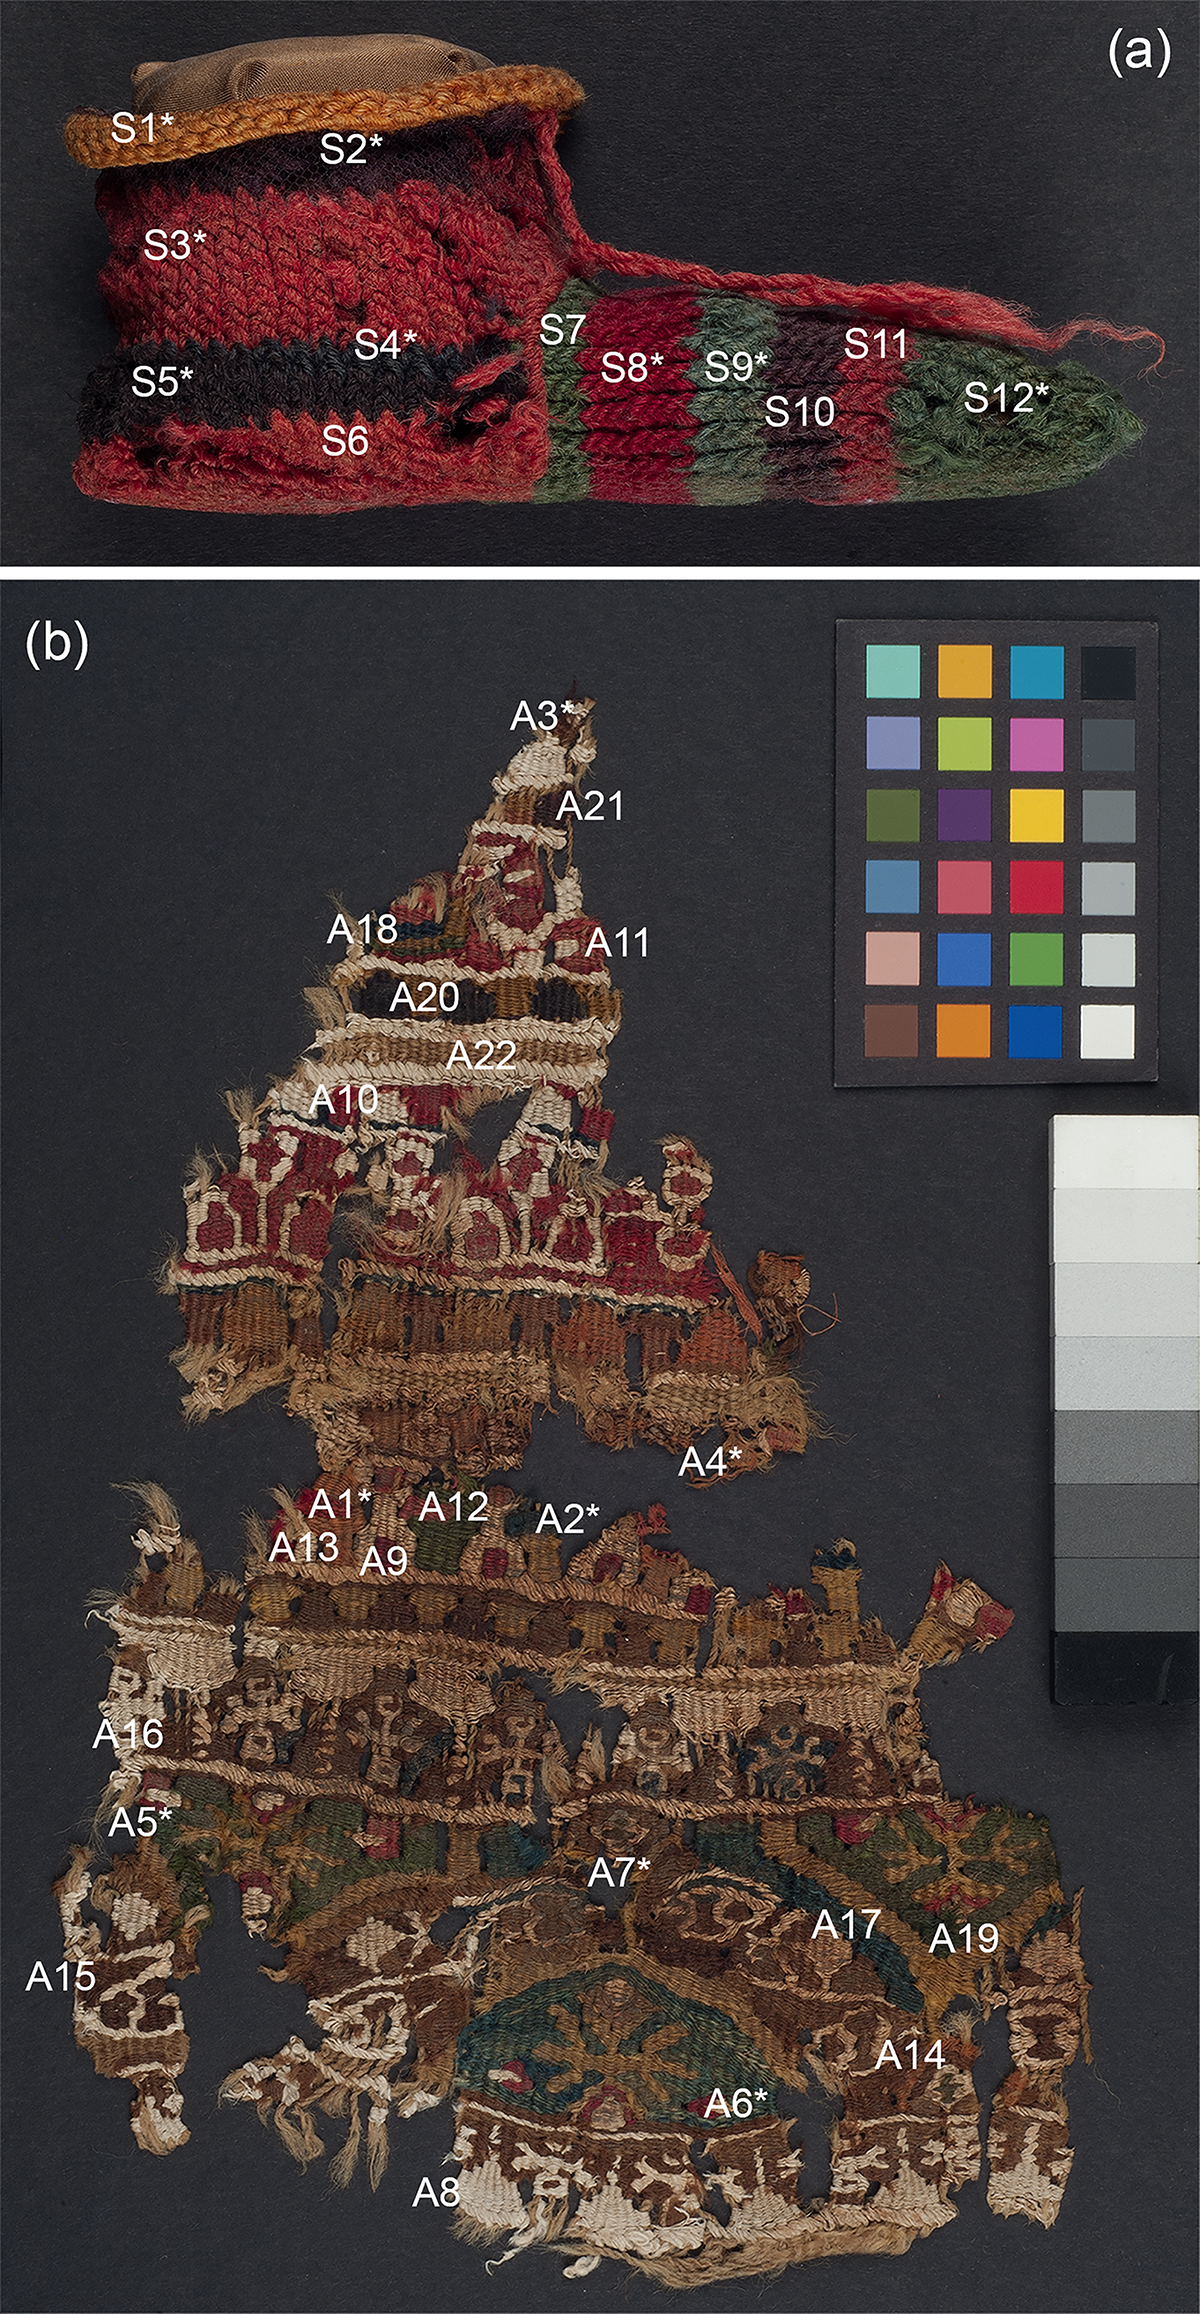
For analysis, the researchers divided the sock’s observed bands into twelve areas labelled S1–S12.[2] Those labels belong to the modern study, not to its ancient maker. Multiband-reflected imaging brought out areas containing an indigo-type blue colourant. Some bands that look green or purple to the eye also involve combinations of blue with other colourants. An image signal alone cannot securely name the plant behind every hue, which is why the paper connects imaging to other measurements. It reports components associated with a Rubia species in some red and purple areas, while warning that identification of the exact madder species in archaeological samples is difficult. The conclusions concern the examined sock and sampled areas; they cannot be extended to every sock made in Roman Egypt.
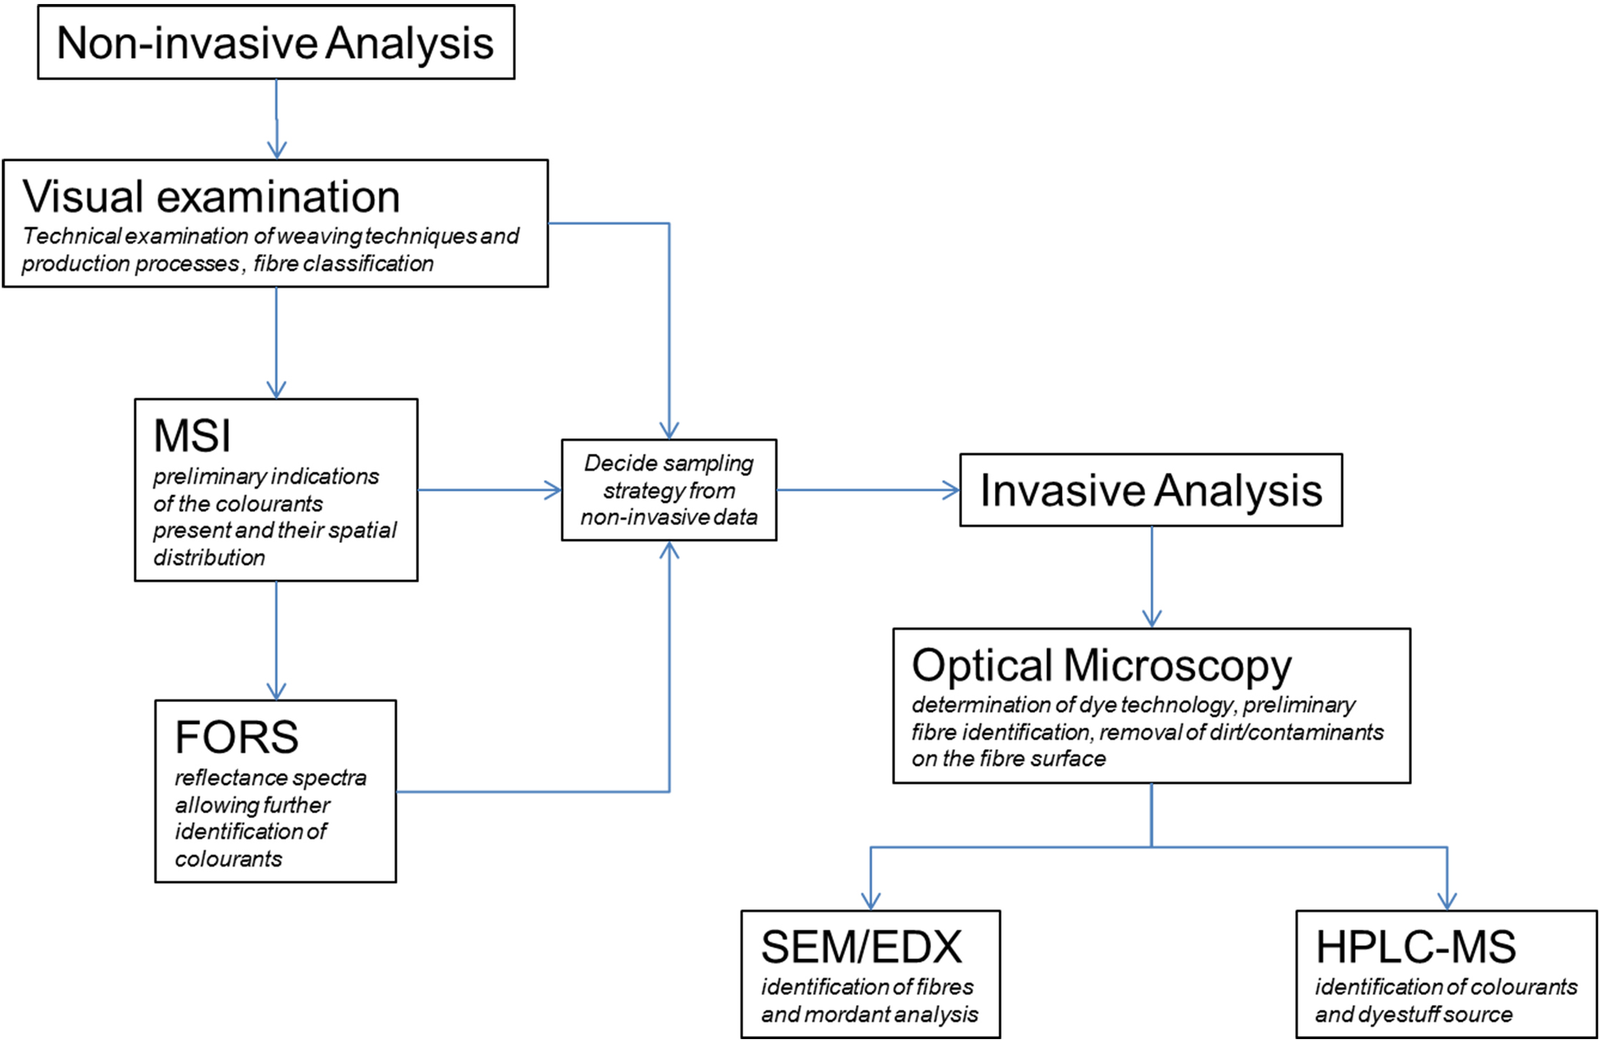
The asterisks beside bands in Figure 1 are sampling marks, not decoration. The team took fibre-optic reflectance measurements at all twelve areas and selected eight small samples from representative points.[2] A photograph locates the areas; reflectance measurements compare their responses to light; analysis of the selected fibres narrows the material question. These stages do not carry equal certainty. A blue-looking area cannot be translated straight into a named dye plant, and the eight samples cannot stand in for every untested loop. Anyone considering a modern colour reconstruction should keep the measured components, present appearance and untested bands apart.
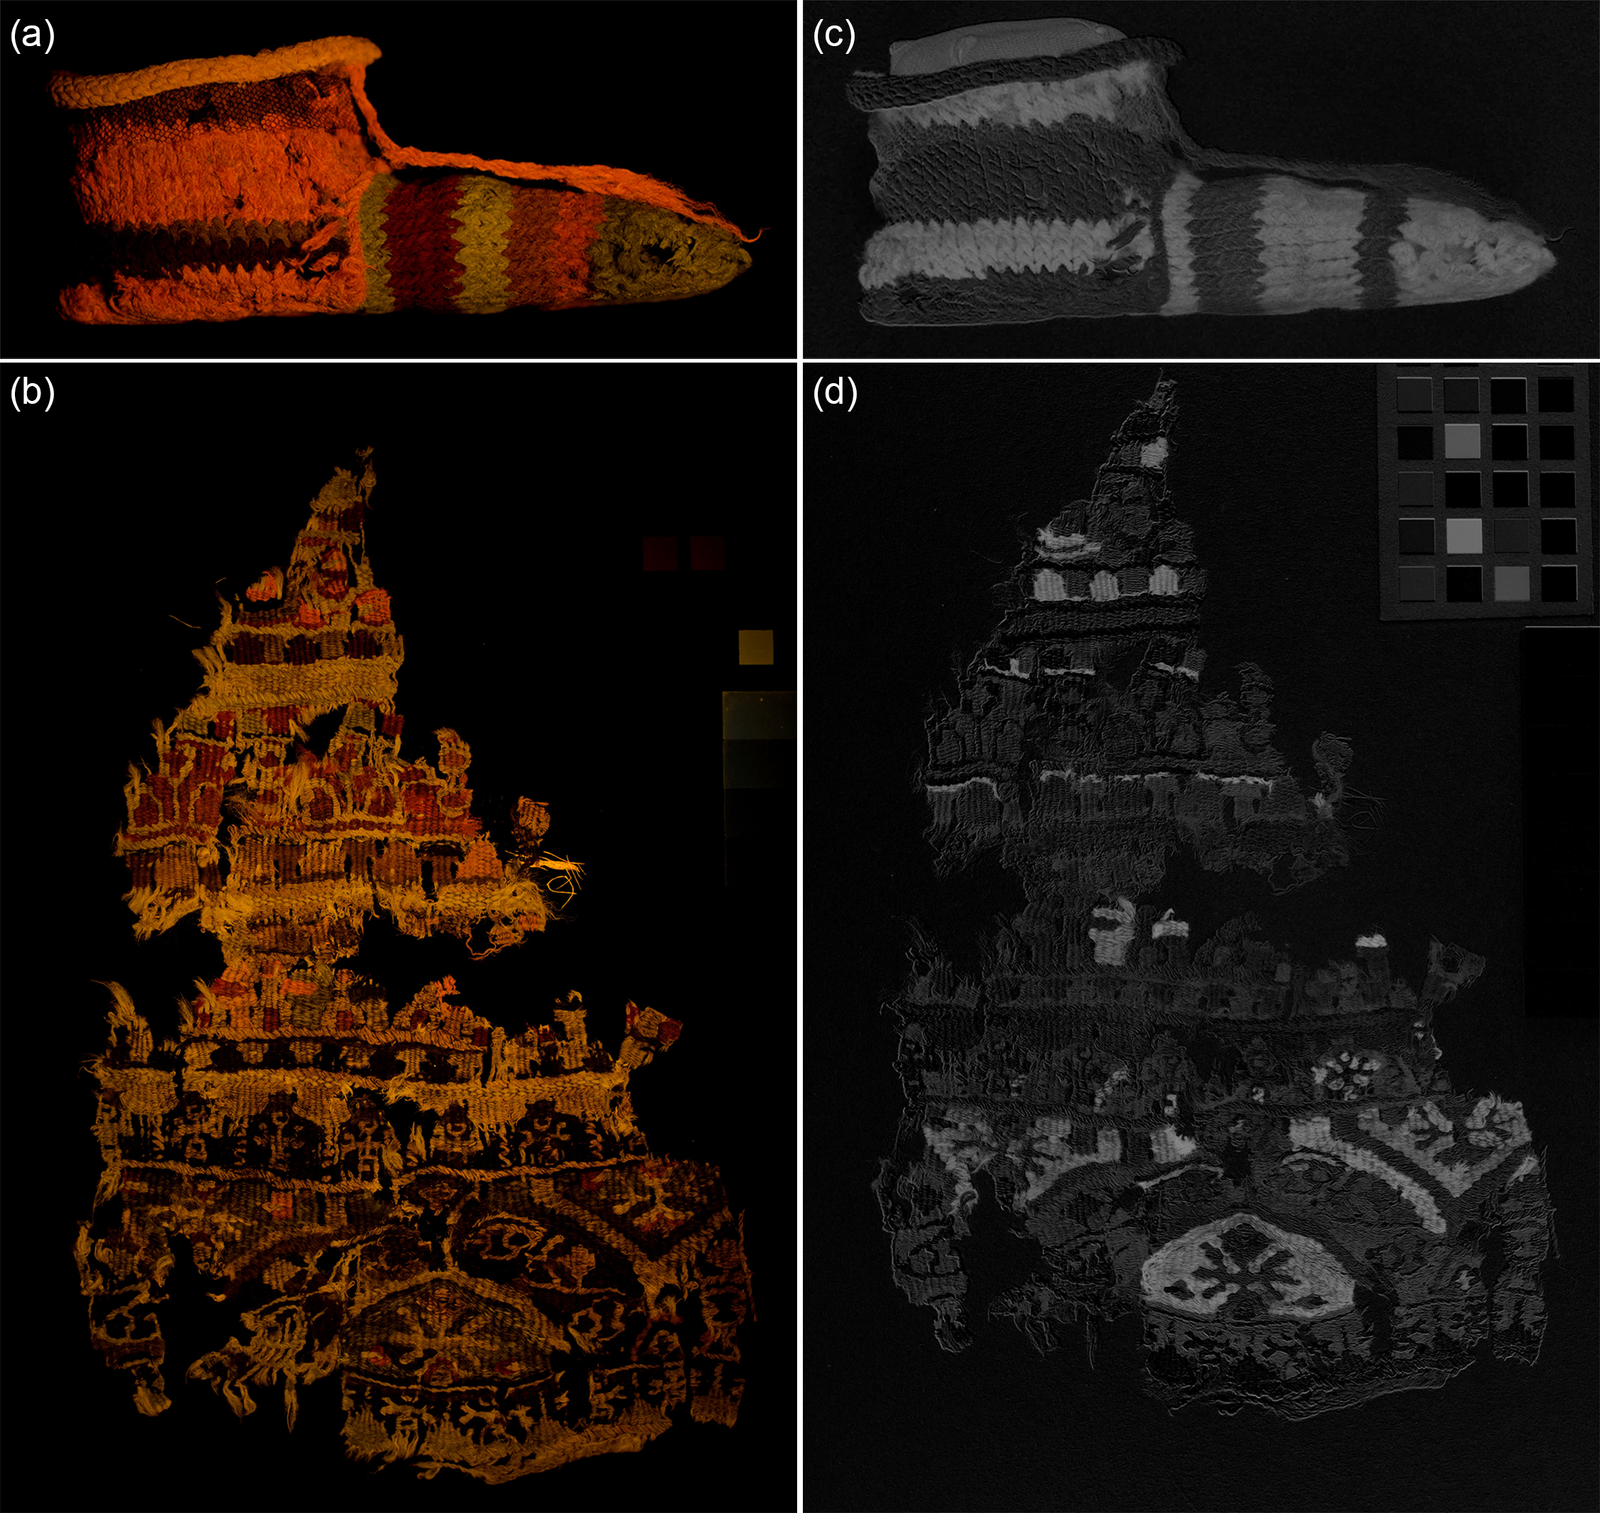
The comparison helps explain why another textile appears beside the sock. Across the study, the researchers examined one sock from Antinoupolis and three furnishing-textile fragments from Wadi Sarga.[2] They applied related imaging and analytical methods to ask how the objects differ. The lower row of Figure 8 therefore cannot provide another view of a toe or heel. Before drawing a conclusion from an archaeological figure, it helps to separate an image that adds another specimen from an image that changes how the same specimen is seen. That distinction also prevents a single urban find from becoming a claim about all socks made in Roman Egypt.
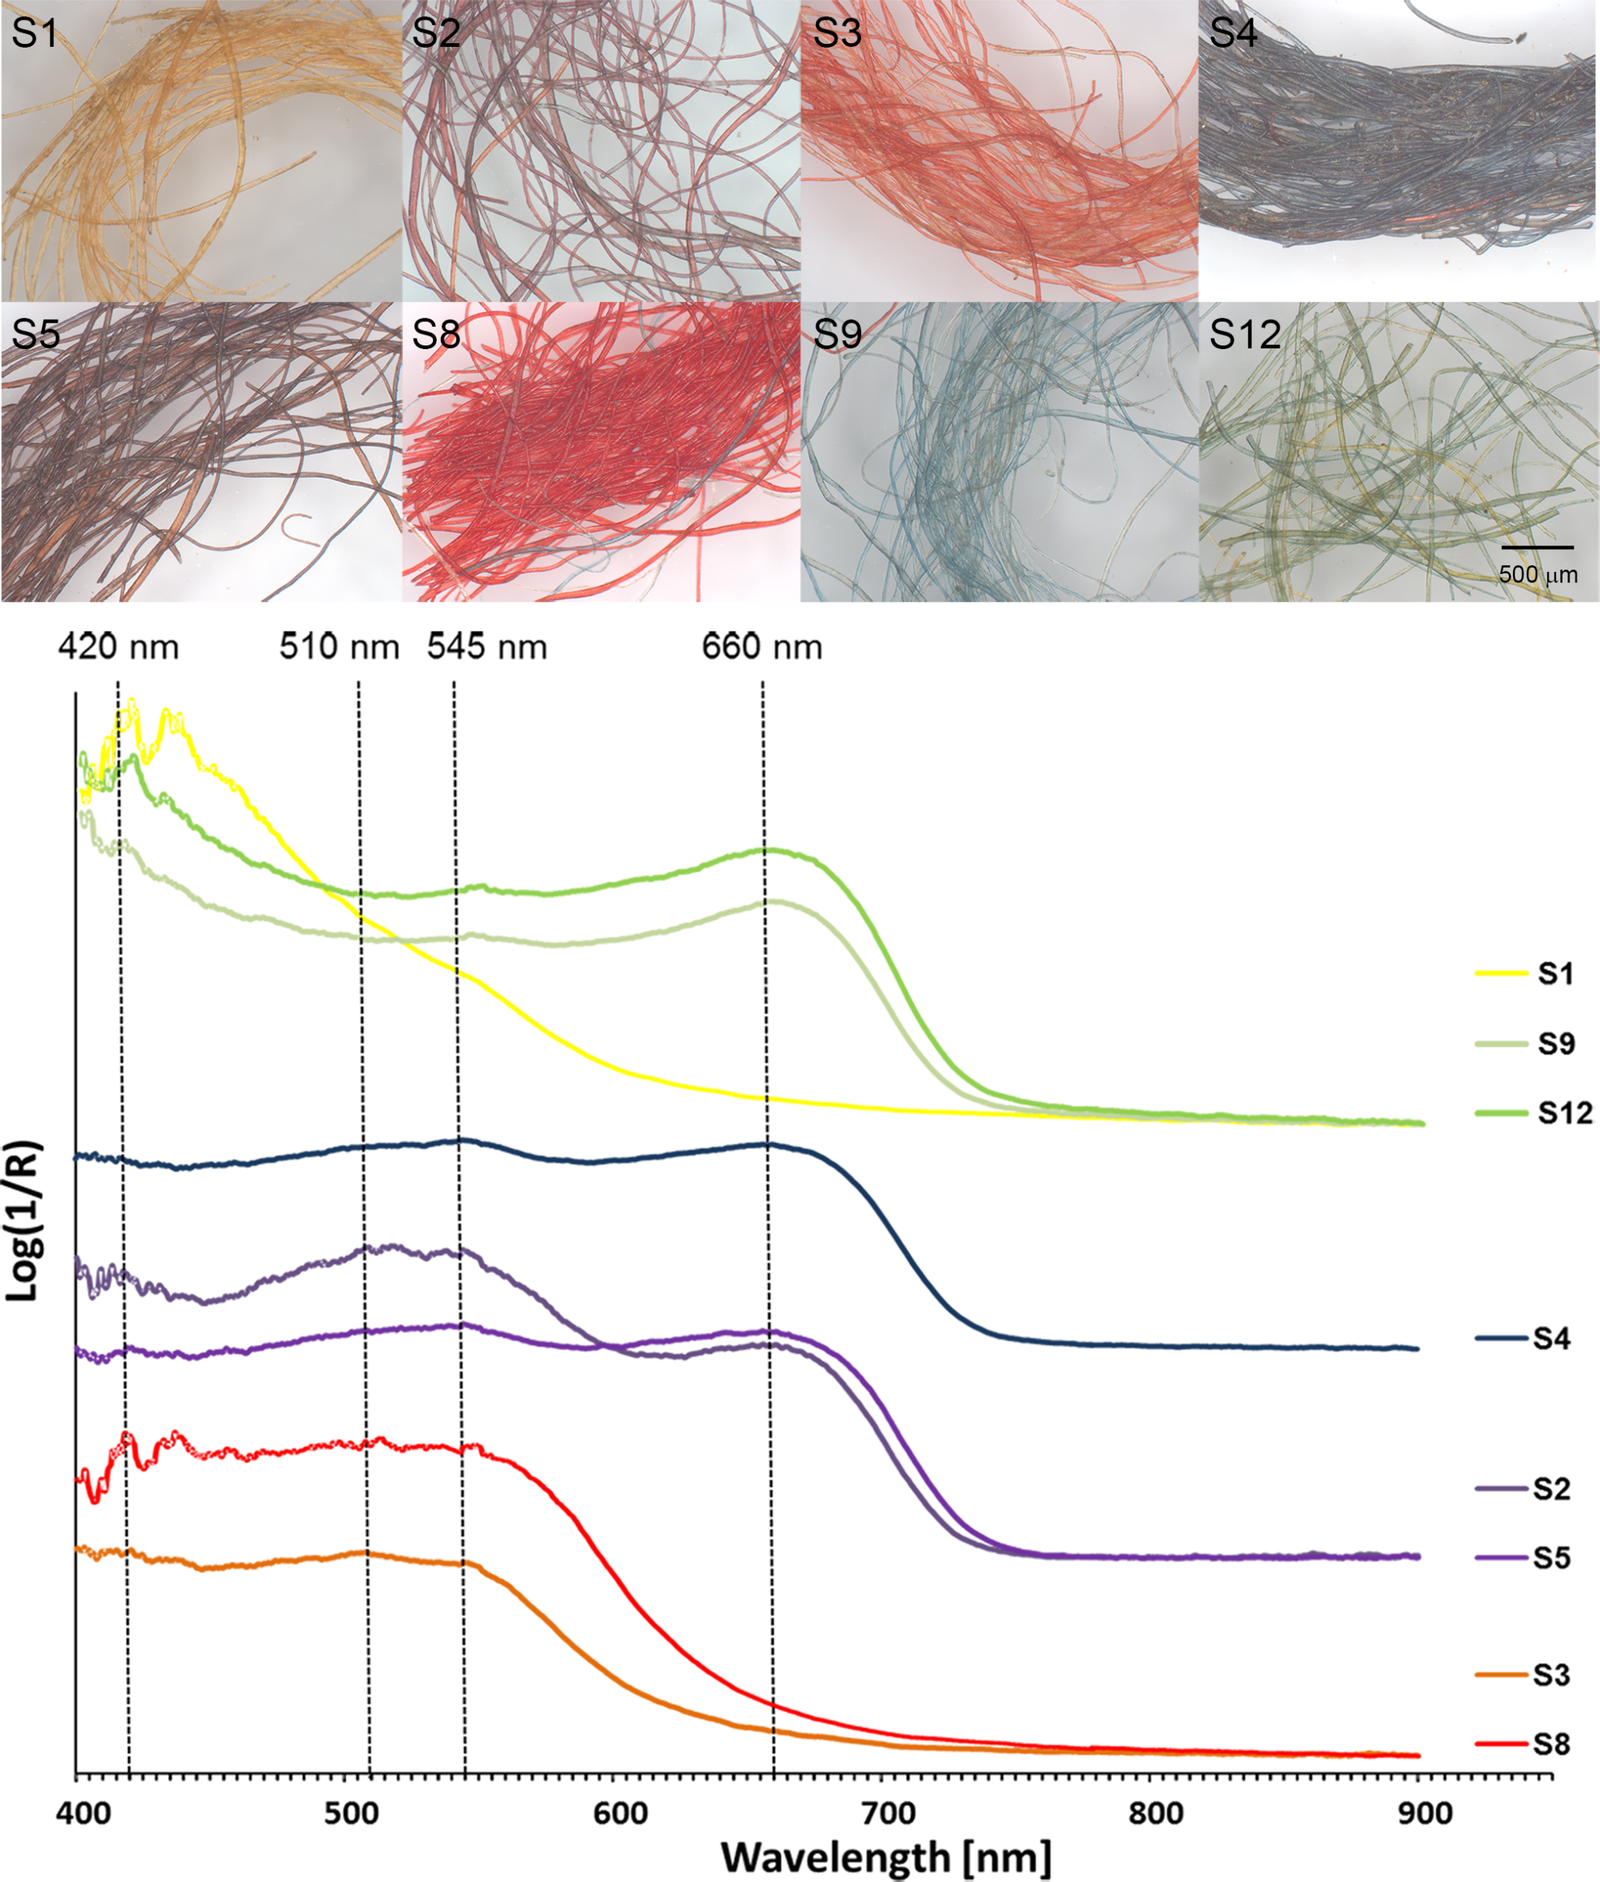
For a maker tempted to reconstruct the sock, these figures work better as an observation map than as a finished pattern. In Figure 1, locate the boundary between the big-toe pocket and the section for the other four toes, then mark the join and the instep welt described by the study. Compare the same bands across the six imaging modes in Figure 4. In Figure 10, remember that a sample label names a selected area, not the entire sock. Those are observations from the object and the analysis. The five figures do not give an exact sequence of needle passes, yarn tension or instructions for joining a modern version of the split toes. Any such choices in a reconstruction would be a new maker’s hypothesis, not a fact documented by this paper.
The maker’s name has not survived in these records. The named people here are the researchers who studied the object, not an identified ancient sock maker. Their imaging helps us ask more precise questions about where colourants occur, but cannot recover that maker’s identity or working conditions. This sock offers a three-step way to look. First, distinguish a change of imaging method from a change of object. Next, follow the structure where the two toe sections join. Finally, separate the museum’s technical looping classification from the exhibition card’s broader word knitted. Looking more than once is useful because a single colour photograph cannot answer every question about the textile.
Primary sources by claim
- British Museum EA53913 collection record: left-foot child’s sock, Antinoupolis, dating, material and single-needle looping.
- Dyer et al., 2018, PLOS ONE: construction, bands, imaging and sample analysis; Figs. 1, 3, 4, 8 and 10.
- British Museum EA53912 collection record: separate right-foot brown sock and technique.
- British Museum 1901,0314.35 collection record: red split-toe sock and technical classification.
- British Museum 2024 Legion activity cards: public-facing
knittedwording for the red sock.
If you enjoyed this story, please leave a warm greeting.
No name or email is needed. Greetings are published immediately, and your country and a masked IP address may be shown. The original IP address and browser information are stored with your greeting for comment management, spam prevention and security. Privacy policy and deletion requests
This product includes GeoLite Data created by MaxMind, available from https://www.maxmind.com.